Monday, February 18, 2013

John the Math Guy breaks out of the blog, Jan 2013

I have been hiding in my blog for a while, and decided it would be a good idea to get out to see more of the internet. Here are some of the tracks I have left elsewhere.

Labels and Labeling magazine


Adrian Tippets (a good friend who I have never actually met in person) read my blog post called "Layman's Guide to ISO Standards". He liked it so much that he hooked me up with the wonderful folks at Labels and Labeling magazine. One thing led to another, and "ISO comes to in-line color" was born. Here is the summary:

Achieving ISO compliance with an in-line spectrophotometer is a more difficult project than first appears. John Seymour, color expert at QuadTech, lays out the issues.

Munsell blog

I had an interesting interchange of blogs with Jeff Yurek. Jeff writes an entertaining blog with the uber-cool name "dot color". (I wish I could think of names like that.)

The interchange started with "Why does my cyan have the blues?" Jeff Yurek (a close, close friend who I never met) read this post and was obviously totally blown away my the incredible writing style and the vast knowledge that I evinced with my post. Or maybe he was just desperate for a blog post topic? Either way, he summarized my post in his blog post "How does ink thickness change the appearance of printed color?". 

Turn about is fair play, right? I was desperate for a blog post topic and I decided to co-opt ideas from his blog. I came across a post of his about the Seeing red: can color change your spending habits?. I decided to play off this post by doing extensive research into universality of opinions of color gurus on the psychological effect of the color red. I spent nearly a whole hour on the research that went into the post "Red is the color of..."

Jeff and I played ping-pong for a while. He did a post called  "Shopping for a tablet this holiday season? Don’t forget to look at color performance". Many reviews of the various tablets look at display resolution (pixels per inch). He looked at the color gamut of the displays - how many colors can the display produce.

I followed up with Does my dog appreciate my KindleFire display? in which I either looked at a) tablet apps for testing colorblindness, or b) color-blindness in dogs, or c) the gamuts of various tablet devices, or d) my superior color vision over my wife. I'm not sure what the post was really about, but I got many comments on it, so I followed up with Follow up on colorblindness testing.

Well, Munsell makes stuff for testing colorblindness, so this got the attention of Noni Cavalerie, who is the social media-savvy social media person for Munsell. In particular, she handles the Munsell color blog. Noni, of course, is one of my oldest and dearest friends that I have never met. She couldn;t take it anymore, so she asked me to guest blog. Naturally, I took a subject near and dear to my heart - why I am superior to my dog:  Evolution Trichromacy.

In case you are wondering about this vast superiority I have over my dog, it's because he is colorblind, and I have an opposable thumb. If you want to know why evolution favored primates with trichromatic vision (three types of color receptors), you'll have to read the dog blog.  

FlexoGlobal magazine

I posted a blog called Where are my CIELAB knobs?. My dearest friend Laura Hatch, of FlexoGlobal magazine (a friend who I actually did meet once) liked the blog and asked to repost it. I modified it a little (meaning, I took out the silly stuff), and she made it a Where are my CIELAB knobs?.

Wednesday, February 13, 2013

The function of the heart

There is some holiday coming up. Can't quite think of what it is... I'll have to ask my wife. She knows these things. I hope it's not my anniversary, cuz she would get upset with me if I forgot that. I am pretty sure that our anniversary is in December or March or something, so I think I'm in the clear.

Anyway...

The half-wing function

Let's start with a polynomial equation, we'll call it p(x). I will define it as the sum of three polynomials:


The first of these polynomials, p1(x), is linear in x. I'll have it going from k1 at x = 0, down to 0 at x=pi .

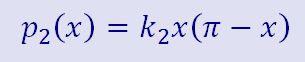
The second polynomial, p2(x), will be 0 at both ends and a second degree parabola in between. In this way, no matter how big I scale it (by using my handy k2 parameter, it won't affect the value of p(x) at the ends. Whenever I get a chance to do this with a polynomial, I go for it.  

I have one more polynomial, we'll make this one a cubic parabola. This one will get nailed down at the ends (x = 0 and x=pi), and will also be zero halfway in between.

I can pick values for the three parameters to give me any cubic polynomial that goes through (0, k1) and (pi, 0). How cool is that? Just for kicks, I chose k1 = 2.0, k2 = 0.3, and k3 = 0.6. The plot below shows the very agreeable cubic polynomial that is generated this way.

The half-wing function

I could have just played with the standard (canonical) form of the cubic parabola, but that gets confusing. with this formulation, k1 allows me to adjust the starting height, k2 allows me to adjust the amount of torsional wiggle, that is, how much the left half bows down and the right half bows the other way. Finally, the k3 parameter allows me to adjust the midpoint up and down.

I did a little work with this idea of expressing polynomials differently a while ago. One particularly cool thing is that this leads to a way to do regression that always goes through some fixed points.

The full-wing function

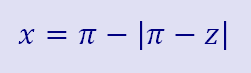
I like that function, but I would like to see the other half of the wing. I can use the absolute value function to flip this function over. Now the variable along the abscissa is z. I use z to get x, and then plug x into the equation for p. Back when I was teaching algebra, I would say that the absolute value function is like a tavern. Whether you are negative or positive going in, you will always be positive coming out.

The flipping function

This flipping over function gives me a wonderful plot of a pair of sea gull wings, symbolizing peace, since sea gulls are very peaceful animals and never hurt another living thing. Or maybe the plot looks like a champagne glass. That kinda reminds me of some holiday, but I can't quite place it.

The full-wing plot

Going polar

Sea gulls sometimes go to the North Pole. Or maybe that's penguins. I dunno. Some bird flies up to there. Anyway, that whole polar thing gets me thinking about (what else) polar coordinates. The full-wing plot already goes from 0 to 2pi. Maybe I should plot it in polar coordinates? Here is how I get from one to the other.

Now it's just a matter of plugging it all into Excel. I entered all this stuff into a spreadsheet. I let z go from 0 to 2pi in kinda small steps. I computed x by using the flipping function. I computed p(x), with the values of the k parameters. And these all went into computing a sequence of (x, y) values. Just for grins, I decided to plot them.

Now that I have the blog written, I need to go find out what day I was supposed to be remembering!

I christen this function the Madeloid, in honor of my wife, the Gypsy Songstress, the Shopping Maven, the love of my life.

Would you like a copy of the spreadsheet that created this? Send me an email at john@johnthemathguy.com.


Thursday, February 7, 2013

A spectrophotometric romance

This is a romantic love story. The usual... boy spectrophotometer meets girl spectrophotometer. Sparks fly, and naturally, they fall in love. I haven't cast the parts yet, but I am thinking Jennifer Aniston could play the female lead. My wife might like to see Antonio Banderas as the male spectro.


But like all romantic comedies, there has to be a conflict. In this movie, they start to disagree.
This part of the movie is quite familiar to me. As a guy, I see this disagreement with my little spectrophilia on a daily basis. Is the blouse on that cute young lady teal, aquamarine, cyan, or turquoise? No matter what I say, I know there will be an argument. As a mathematician, I can readily calculate that my odds of winning the argument are no better than 0 in n, where n is a really big number. I mean, really big. Like so close to infinite that you can taste it. 

But as a color scientist with an ego the size of the planet Jupiter, it's hard for me to just let this go. I should know my colors, right?!?!?!??

So I can relate, as can any male, married, applied mathematician color scientists. I think this covers just about everyone who reads this blog.

One would think that they would agree. They are in love, of course. There are these expectations. IFRA published a report [1] on this expectation:

Inter-instrument agreement is usually indicated by a colour difference value between two instruments or between a master instrument and the average of a group of production instruments. Although various ways are used to describe this colour difference, a common value is the average or mean value for a series of twelve British Ceramic Research Association (BCRA) Ceramic Colour Standards Series II (CCS II) ceramic tiles. A value of 0.3 ΔEab is acceptable. 

How much do our hapless lovers disagree? I did a little research. I went digging for technical papers and reports where others had brought spectros together to see how much they agreed - to assess inter-instrument agreement.

Study
Number of Instruments
Samples Measured
Reference
Errors
Nussbaum [2]
9
BCRA Tiles
NIST Standard
8 of 9 >2.0 ΔEab
Radencic [3]

8
Two each from four different manufacturers
Lab-Ref card
Median of all instruments
All >1.0 ΔEab,
Max. 10 ΔEab
Wyble and Rich [4]
3
BCRA tiles and ink
Paired comparison
Avg. 0.73 ΔEab to 1.68 ΔEab
ICC [5]
3
Three units of the same model
Gravure printing
Identical model
Avg. 0.47 ΔEab,
Max. 1.01 ΔEab
Dolezalek [6]

3
46 patches
5 stocks
Paired comparison
50% >1  ΔEab,
20% >2 ΔEab
Hagen [9]

20
Field study of in-use instruments
13 patches
GretagMacBeth NetProfiler card
Avg. 1.56  ΔEab,
Max. 3.77  ΔEab
X-Rite [10]
6
One of each of their models
46 patches
9 substrates
Paired comparisons
0.27  ΔEab to
1.08  ΔEab

Looking at the far right column of this chart, it is clear that there are virtually no spectrophotometers that are acceptable by the criteria set forth by IFRA. (Understatement alert) There appears to be something of a disconnect between the expectation of inter-instrument agreement and the actual disagreement that will be seen.

What to do?

I turn to a couple of my friends, Danny Rich [9] and Harold Van Aken [10]. (I was honored to be present last night when Danny received some prestigious award or other for lifetime commitment to blah blah influence on the industry blah blah blah best screen adaptation of a spectrophotometric calibration method.... whatever. The award was prestigious anyway. Tears, laughter, speeches. I am not jealous, by the way. Not trying to put him down. Honest. No, I mean really. [11])

The idea put forth by these two really smart guys is that at least some of the discrepancies between spectrophotometers are due to understandable and predictable phenomena. If the understandable phenomena can be quantified, then they can be corrected.

Here is where the BCRA tiles show up in the movie. I am sure everyone has been expecting this. Who says romantic comedies are predictable. If I have any say in the casting for this movie, I would have George Clooney play the part of the BCRA tiles. He would play a therapist, and would try to help are two hapless spectros to reconcile.
George "BCRA" Clooney does all the usual psychotherapeutic stuff, and there appears to be some agreement on the difference between beige and taupe. But, alas, the improved relations falter and once again the couple are disagreeing, in some cases louder than before. This is a totally unexpected turn of events in a romantic comedy, right?

The table below shows what happens when the BCRA tiles are brought in. Before standardization on the BCRA tiles (this is a fancy word for what us plebeians call calibration) we see median agreement of 0.35 ΔE, 0.66 ΔE, etc. on the four different test sets. 90th percentiles are in parentheses below. After standardization, we see that the 90th percentile agreement of the two instruments is much better than before - on the BCRA tiles, going from 1.84 down to 0.95 ΔE. 

But the other sets of samples? Not much improvement at all. The paint samples that were measured (the Behr samples) actually got much worse in the 90th percentile. Much worse,


Test set


Regression set
BCRA
Pantone primaries
Pantone ramps
Behr ramps
Before standardization
0.35
(1.84)
0.66
(1.69)
0.49
(1.60)
0.63
(1.72)
BCRA
0.41
(0.95)
0.53
(1.80)
0.50
(1.31)
0.60
(2.76)


So. George Clooney, favored because he is the analytical psychotherapist, and because he is just a darn sexy guy, has failed. Now we get the unexpected twist that is to be expected in all romantic comedies. Enter Owen Wilson, dufus extraordinaire.
Owen plays "Behr". He plays a dufus ne'er do well. In his normal inept way, he proves himself to be fully ept. in getting the pitiable instruments together. The tie in to the serious side of this blog is set of paint samples. I walked into a Home Depot. Please don't let them know, but I was just pretending to be buying paint. I looked at the Behr paint samples and selected a set based on being cute. (Get this... I selected Owen "Behr" Wilson because he is cute.)
The 24 colors in the Behr paint samples

The table below (bottom row) shows the results from using the Behr paint samples to standardize the instruments. Note that the worst case examples are all more better, and most are way more better.


Test set


Regression set
BCRA
Pantone primaries
Pantone ramps
Behr ramps
Before standardization
0.35
(1.84)
0.66
(1.69)
0.49
(1.60)
0.63
(1.72)
BCRA
0.41
(0.95)
0.53
(1.80)
0.50
(1.31)
0.60
(2.76)
Behr ramps
0.50
(0.81)
0.66
(1.26)
0.44
(1.07)
0.11
(0.26)

So, thanks to the help of Owen "Behr" Wilson, they lived happily ever after.

Scientific conclusions

Ok, now for something completely different. This is the serious part.

First, before Home Depot has a run on samples of the pretty color set, let me say that the set I chose was not scientifically chosen. In a totally uncharacteristic way, I actually told the truth about just picking out the samples based on being pretty. The set was nowhere near perfect. I am sure it could be optimized to make it smaller and more better. I am guessing this might happen.

Second, note that the improvement in inter-instrument agreement is not fabulous. I am guessing that better agreement might not be possible. Sorry.

Third, this experiment is a practical example of a point I made in a previous blog. Regression can go bad if you try to push it too far.

This blog post is derived from my paper, "Evaluation of Reference Materials for Standardization of Spectrophotometers", presented earlier this week at the Portland TAGA conference.

----------------------------------
[1] Williams, Andy, “Inter-instrument agreement in colour and density measurement”, IFRA special report, May 2007

[2] Nussbaum, Peter, Jon Y. Hardeber, and Fritz Albregtsen, “Regression based characterization of color measurement instruments in printing application”, SPIE Color Imaging XVI, 2011

[3] Radencic, Greg, Eric Neumann, and Dr. Mark Bohan, “Spectrophotometer inter-instrument agreement on the color measured from reference and printed samples”, TAGA 2008

[4] Wyble, D. and D. C. Rich, “Evaluation of methods for verifying the performance of color-measuring instruments.  Part 2: Inter-instrument reproducibility”, Color Research and Application, 32, (3), 176-194

[5] ICC “Precision and Bias of Spectrocolorimeters”, ICC white paper 22

[6] Dolezalek, Fred, “Interinstrument agreement improvement”, Spectrocolorimeters, TC130, 2005

[7] Hagen, Eddy, “VIGC study on spectrophotometers reveals: instrument accuracy can be a nightmare”, Oct 10, 2008, http://www.ifra.com/website/news.nsf/wuis/7D7D549E8B21055CC12574C0004865FC?OpenDocument&0&

[8] X-Rite, “The new X-Rite standard for graphic arts (XRGA)”, CGATS N 1163

[9] Rich, Danny, “Graphic technology — Improving the inter-instrument agreement of spectrocolorimeters”, CGATS white paper, January 2004

[10] Van Aken, Harold, and Ronald Anderson, “Method for maintaining uniformity among color measuring instruments”, US patent 6,043,894

[11] All kidding aside, Danny is a great guy and has been a mentor to me. I am proud to be able to call him a friend. Here is an announcement of Danny being awarded the Robert F. Reed Technology Medal.