Warning: The following blog post is rated PG for "Print Geek". Some material may not be suitable for people who aren't rabidly interested in printing, print metrics, and color science.
Where are my CIELAB knobs? (Part 1)
Back in the good old days, it was all about density. From the standpoint of the printer, density makes a lot of sense as a process control parameter. Density is a single number, and it relates directly to the only thing that can be easily controlled on press, the amount of pigment put down.
But those were simpler days. Nowadays, those darn standards, such as the ISO 12647 series and FIRST 4.0, and that whole ICC profile thing – all they talk about is CIELAB this and L*a*b* that. From the standpoint of the print buyer, this is a perfectly reasonable request. Running to a target density does not assure the proper color. A density measurement can’t tell you whether there is an unwanted tint in the ink, say, a yellow ink spiked with a bit of cyan. And even if your ink is "pure", difference in paper color and gloss do not always translate well from density to color.
Going back to the printer again, running a job to a CIELAB target is something of a problem. There are no knobs for L*, a*, and b* on a press. At least until now... A little startup company called TheMathGuy has introduced a fundamentally new way of printing. The JMG 1000 has separate print units for L*, a*, and b* [1].
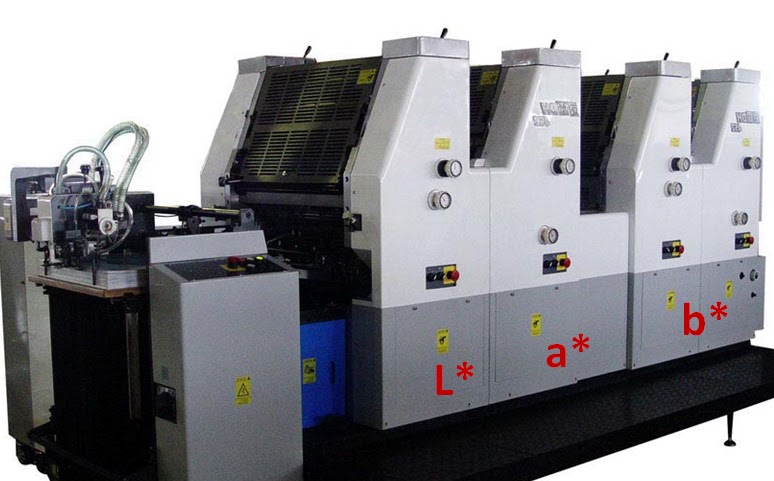
The new JMG 1000 CIELAB press, with L*, a*, and b* print units
If you were a naughty press guy, and Santa did not slide down your chimney with a brand new JMG 1000, you are stuck in the transition period from antiquated technology to the wave of the future. You need a way to determine the optimal density, that density that will get him closest to the target CIELAB value. This is part 1 of an article that describes the theoretical background of how to bridge this gap. Part 2 will talk about software that has been developed to deal with these issues.
First graph
At the very least, having a gosh-darn CIELAB target makes the whole thing very complicated. The correspondence between pigment load and CIELAB values is not so straight-forward. For a black ink, more pigment means L* goes down, but a* and b* stay the same. Ok, that's easy. But for yellow ink, more pigment only decreases L* a small amount, but the b* value increases. For cyan ink, L* and b* both go down, but the a* value drops at small densities but then levels off, as shown as in Figure 1 (red line). (Are you taking notes? I am the math guy, and I have to stop and think about this as I write it!)
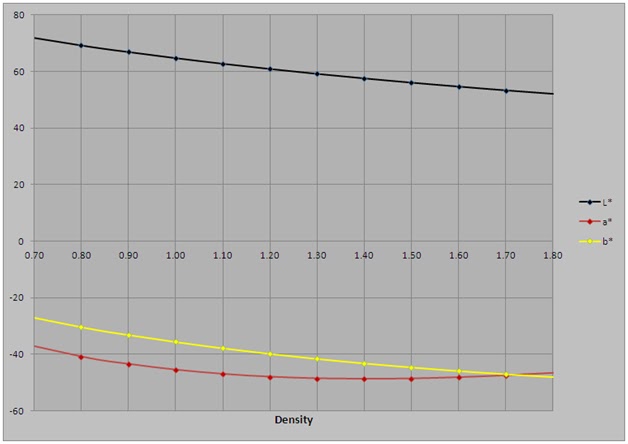
Figure 1 – How the CIELAB values change with density (cyan version)
A slightly better graph
The rules for how CIELAB values change and the graph in Figure 1 are just not human-friendly ways to look at how to hit the target color. Can we do better?
Figures 2a and 2b are a little more intuitive look at the same data portrayed in Figure 1. These are plots of the ink trajectory for cyan [2]. Looking down at color space from above, the plots show the change in color of a cyan solid as the pigment gets richer. Note that color is three dimensional, and the “up and down” (L*) is not shown. L* goes down as the ink gets richer in color.

Figure 2a – a*b* plot of cyan ink from a density of 0.8D to 1.8D
One notable feature of this graph is the hook at the end. When the ink reaches this hook, adding pigment will no longer increase the chroma (perceived saturation) of the ink. But adding pigment will change the hue. As you add pigment, the hue of the cyan ink turns toward blue. Anyone who has looked at a bucket of cyan ink has seen this change in hue. Anyone who has read my post Why does my cyan have the blues can explain in great detail why this happens.

Figure 2b – Close-up of 2a, with the target and several density points indicated
Figure 2b illustrates how the ink trajectory can curve around any particular CIELAB target value. In this graph, the target is somewhat arbitrarily shown as a* of -48 and b* of -44. In this case, it is not possible to exactly hit the target color. Adjusting the pigment level is like missing an exit ramp on an interstate highway. You just watch your destination go by as you drive past.
But it’s not the end of the road. The goal on press is not to actually reach the target color – just to come close enough. From the looks of Figure 2b, it would appear that the closest match occurs at a density of just below 1.50D. It would appear that the press operator just has to hold to a density around 1.48D to assure that the target color is met as close as possible.
That closest match – the point on the ink trajectory that is closest to the target color – is called the perifarbe. The prefix of this word is shared with the words perigee and perihelion, meaning the closest approach of a satellite to the Earth or the Sun, respectively. “Farbe” is the German word for color. [3]
But before everyone goes out and jots 1.48D in their notebooks, I need to add two more things. The first is that the perifarbe density depends on all the variables in the process. Any change in the ink formulation or substrate will potentially result in the perifarbe moving. The perifarbe density should be determined whenever something changes, and ideally is calibrated on every run.
There is a little difficulty, though. Figure 2b is only part of the story. It neglects how L* is changing with respect to density. Figure 2c shows a different perspective, looking at color space from the side, rather than down from the top. In this plot it looks like the perifarbe density is somewhere around 1.39D.

Figure 2c – Close-up of 2a, viewed in the b*/L* plane
The perifarbe graph
This failure in Figures 2a, 2b, and 2c leads us to a third diagram that allows one to determine the perifarbe, shown in Figure 3. The black line in this plot shows the color error (ΔE distance from the target CIELAB target) at each density. From this, it can be seen that the perifarbe density is a bit lower than either of the views in Figure 2 would have led us to believe. The true perifarbe is at 1.38D.

Figure 3 – Plot of distance to target CIELAB value
Figure 3 also gives us an idea of how hard it will be to keep this job in tolerance. If the customer requires that the color be within 4 ΔE (as shown by the dashed green line), then a fairly wide range of density will bring the color into tolerance. Anywhere from 1.23D to 1.55D would be acceptable. If, on the other hand, the tolerance is 2 ΔE (as shown by the red dashed line), the acceptable density range is from 1.34D to 1.41D, and even at its best, the color will be borderline acceptable.
Summary (part 1)
In this first part, I have discussed the difficulties posed by having target CIELAB values. Through a series of different types of graphs, I have described from a theoretical standpoint what is possible. Along the way, I have introduced the phrase ink trajectory, which is the collection of CIELAB values that you can get with a given ink through adjustment of the pigmentation level. The idea of a perifarbe has been introduced, which is the point along the ink trajectory that comes closest to a target CIELAB value.
In the next part, I will take a look at various pieces of software that are available to simplify the color tweaking process on press.
Where are my CIELAB knobs? (Part 2)
In the first part of this blog post, I looked at the problem faced by printers when trying to control a press to CIELAB tolerances. I explained, through a series of graphs, how the problem could be solved. The approach, however, was theoretical. This second part of the article takes a look at practical solutions in the form of software that can be used at press side to help tune the press to the optimum CIELAB value.
How can I use this on press?
All these fancy graphs from the first part are helpful to get an understanding of what is going on, but the most important two pieces of information needed are the perifarbe density (what density gets me closest to the target CIELAB), and the perifarbe ΔE (how close can I get). Between these two numbers, the press crew can decide whether to a) leave well enough alone, b) adjust the pigment levels at press side either up or down, and by how much, or c) send the ink back to the kitchen for re-formulation.
Several options are available to make use of this analysis. While it may be possible to hire a competent applied mathematician to run a slide rule at press side, there are other possibilities that are perhaps more cost effective [4].
Some spectrophotometers come equipped with a feature that can predict these two important numbers. The TECHKON SpectroDens is one example. In the screen shot shown in Figure 4, a black patch is found to be over 6 ΔE from the target. It recommends increasing the black density by 0.24D, and predicts that the color error will drop to 0.8 ΔE.

Figure 4 – The TECHKon SpectroDens
A similar feature, called “BestMatch”, is available for X-Rite’s SpectroEye. The display is shown in Figure 5. In this example, a sea-foam green patch is measured to have a density of 1.76D. The color difference from the target is almost 7 ΔE, so it recommends reducing the density by 0.31. If this were to be done, it predicts a color error of 0.14 ΔE. One more number is worth noting is the “% -26”. This is a suggested change in concentration.

Figure 5 – X-Rite “BestMatch” feature on the SpectroEye
SpotOn! Flexo software allows this analysis to happen with several brands of spectrophotometers. In addition to being able to generate a variety of reports, Figure 6 shows a screen shot where SpotOn! is recommending running this orange ink to a yellow density of 1.37D. It predicts that the color error at this point would be 1.41 ΔE. This software can take advantage of having a computer screen (rather than the tiny screen on a handheld spectro) to provide additional information. The plot at the right of Figure 6 shows the current and predicted color against the acceptable tolerance ellipses.

Figure 6 – Screen shot from SpotOn! Flexo
Summary (part 2)
The evolution from density control to CIELAB targets is painful, but necessary. This post has described how to make the transition from a theoretical standpoint, and then provided practical examples of software that can ease the blow.
--------------------
[1] Caveat: These presses are not yet available. I am still trying to find a reliable supplier of b* ink.
[2] Ink trajectory is a phrase that I invented. It means the path through color space that the color of an ink takes as you change pigmentation level, ink film thickness, or tone value. Expect to hear this phrase at every TAGA conference. Incidentally, the 65th annual TAGA conference is coming up!
[3] Perifarbe is another word that I have coined. It has become a standard part of the language. I was just in the nail polish aisle at Walgreen's and heard two young ladies talking about finding the perifarbe nail polish color. Honest. If you wish to honor me, then name your yellow lab "Perifarbe".
[4] Applied mathematicians don't come cheap.
Hello John,
ReplyDeleteSince the inks are generally single-hue we can get better mileage using LCh than LAB. Monitoring the Chroma number for the process colors gives better information than monitoring the A and B numbers for color.
Let's keep in mind, too, that color doesn't matter much to a printing press. Those large machines are industrial coaters, designed to lay down a coating upon a substrate. Key process indicators for these machines, how they operate, are the thickness of the film or coating or ink, and the pressure used at the nip. Measuring coating thickness on an absorptive substrate is difficult at any time; measuring that at close to "real time" is impossible. So we use the proxy measurement of density; nulling the densitometer on the substrate first is required to compensate for the color of the substrate. Reading color on the press is confusing and misleading as a process control, then.
Finally, reading color values with a spectro is fine if you seek to compare two samples, but those readings do not reflect how people see things. This limits the value of using color measurements on anything but spot color reproduction.
(What do you mean by "pigment levels" by the way? Is this a measurement of ink film thickness, or the pigment load in the ink?
I used the term "pigment levels" as a generic term that covers ink film thickness for web offset, and pigment concentration for gravure and flexo. The analysis applies equally to both.
ReplyDelete"We can get better mileage using LCh than LAB" - I assume you mean that C* is more useful as a process control parameter? Sometimes C* is helpful, but as you can see in Figure 2a, cyan ink has a hook. After a certain ink film thickness, the density still goes up, but C* doesn't change much. The color change is reflected in h* and L*, but not in C*. Cayn ink gets bluer and magenta ink gets redder, but is not much "richer" in color.
(For more on hooking, have a look at a previous post of mine:
http://johnthemathguy.blogspot.com/2012/09/why-does-my-cyan-have-blues.html)
"color doesn't matter much to a printing press" That's true. You have expressed a press-centric, process control viewpoint which is completely valid. I'm not going to disagree with that.
But, let me express another completely valid viewpoint: "density doesn't matter much to a print buyer". For the person who is paying for the job, color is the only thing that counts.
"Reading color on the press is confusing and misleading as a process control, then."
The point of my post is to provide the press operator with a way to bridge the gap between what can be controlled on press and what the customer really wants. The point of my post is to make the ties between density and CIELAB so that it is less confusing.
"those readings do not reflect how people see things"
I'm having a bit of trouble understanding this comment. It sounds like you are disagreeing here with a lot of research and standardization... the decades of work that went into developing CIELAB and the work of the CIE to make sure that CIELAB actually does reflect the way people see things; the work of CGATS and ISO TC130 that went into the CIELAB specs that are in ISO 12647 series and the upcoming ISO 15339; the work of the ICC in standardizing profiles in CIELAB values; G7's basis in CIELAB for gray target values; and the more recent work of XRite on Pantone Live.
It has been almost 20 years since ISO TC130 had these discussions and concluded that, while CIELAB is not perfect, it is preferred over density.
So... maybe I misunderstood your comment? Or are you disagreeing with all of these standards groups?
I'm not referring to the CIE color system or the various CIE color-matching functions or spaces. I was referring to the spectrophotometer and it's usefulness as a predictor of the human visual response. Our color perceptions are not so simple or single-dimension. The colors we see are seen in a context which the spectro cannot entirely capture.
ReplyDeleteAre you familiar with the work of Ed Giorgianni? His book, written along with Thomas Madden, "Digital Color Management", speaks on this subject.
Too, those instruments are hugely imprecise. Testing a number of Eye1 spectros at a single plant I found variation of up to 14 Delta E for blue, and 8 Delta E for green, measuring the same patch with the same technique, averaging five measurements. Reds were better. Grays were acceptable.
My view is one of a quality management and engineering professional. Call me Paul the Process Guy!
Keep up the good work. It's good getting to know you.