Wednesday, January 30, 2013

Welcome to the sandbox


Building the perfect weather satellite
Many years ago, I had a brief stint at a university, writing navigation software for the next generation of weather satellites [1]. These new satellites were going to be slicker than, well, slick stuff. The new design would solve all the problems of the previous satellite designs.

The university I worked at, however, had not been well-connected to the design process for this satellite. Very little input from the group I was in went into this marvelous new creation. Needless to say, the folks I worked with had a rather negative opinion about just how marvelous the satellite was.

Or should I say, “was to be?” This marvelous project was hopelessly late.

To make matters worse, there was an impending crisis. When the new design had begun, there were two weather satellites parked in orbit above the United States, one above the east coast, and one above the west coast. When an LED in an encoder of one of the satellites burned out, we were left with a single operational satellite. Since a single geosynchronous satellite cannot get a good view of our entire country, the satellite needed to be moved seasonally to track areas of critical weather. Normally parked over the Midwest, it was slid east during hurricane season.

The failure of the satellite left the US in a bad situation. First, weather coverage was lacking, having only one vantage point to view the continent from. Second, we were especially vulnerable to a similar failure of the remaining satellite. Disabling of this last satellite would deal a harsh blow to weather forecasting.
The forecast was a bit odd...

It was the opinion of some of my coworkers that the fancy new satellite was a mistake from the start. The features that were added were mostly golly-whiz-bang features that engineers can get excited about, but which offer little to the end-user of the satellite imagery. This in itself was not the direct problem. The direct problem was that the new design was being chronically delayed in order to get these wonderful new features to work right. In the opinion of my coworkers, it would have been much better to have built several more of the previous generation of satellites.

In the end, the new weather satellite project was way over budget, and very late.

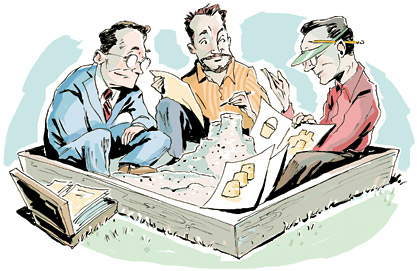
Welcome to the sandbox.

Confession time
Let’s face it. All of us engineers who have been at it awhile are guilty of playing in our sandbox. We got into engineering because we are smart, and we like the kinds of toys that engineers get to play with. Every once in awhile, we get dazzled by the light of our oscilloscopes, seduced by a tantalizing algorithm beckoning us to write it, or beguiled by the charms of the ultimate gizmo.
We sat mesmerized, unable to take our eyes off the Lissajous figure

Enraptured, we rationalize the benefits of this more complicated approach. “Yes, it will take a bit longer to design, but it will be more reliable in the field.” As if anyone else will understand it well enough to assemble it correctly!

Against our own better judgement, we pursue this Holy Grail of Engineering, fully convinced that this is the absolute best choice. We dismiss critics of our design as being “plebeian”, or “short-sighted”. Disagreements only tend to polarize the issue.

Throwing stones at myself
If I were without sin, I would have no qualms against casting stones against any and all. But, since I am as guilty as any, I must cast some stones upon myself.

I was once called upon to build a software tool that would help measure the resolution of images from an electron microscope. A sample with a clean edge would be put in the microscope, and an image would be taken of the edge. A line of data taken from this edge would show the black-to-white transition. The software I was to write would graph this line of data on the screen along with a computed transition. The user (my boss) would adjust the parameters of the computed line until he was satisfied with the fit to the actual data.
ADEM, the electron microscope I helped build [2]

Of course, as a mathematician and software guy, I knew that the computer could do a far better job at fitting a curve to data than any old user. The fact that the fit was nonlinear not only made it considerably more difficult, but also made it more interesting. So, I embarked upon a project of building software to do an automated fit.

All in all, the guy who requested this software from me (my boss) was remarkably patient. He needed a quick answer. He had been a programmer, and had done a fair amount of curve-fitting software in his time. He would have written it himself, but it had been years since he had programmed, and had not learned the programming language we were working in. To nudge me out of the sandbox, he would say things like, “Well, you know it is really tough to avoid local minima when fitting such noisy data.”

Eventually he hounded me enough so that I compromised. I automated the initial settings for the curve parameters, and provided a user interface to tweak the parameters from there. The software was late, but it did what he needed it to do. He was even gracious enough to tell me that the initial settings that my software generated were really quite good
.
It is only in moments of abject honesty that I stop patting myself on the back long enough to remember that I could have satisfied my customer weeks earlier if I had not stopped to play in the sandbox.

Then there was the time that I wasted months developing the absolutely most way-cool disk file structure ever witnessed. It could allocate partitions and coalesce them when done. There were files and linked lists of files. The software used semaphores to protect against multiple concurrent calls to the same routine. The whole thing fit into a structure which had relocatable pointers and a check-sum. The directory was duplicated on disk so that it could be recovered if power was lost during a write.

I wrote a test suite, complete with random a number generator to test this code. I wrote thirty pages of documentation. It was a crowning accomplishment, and a testament to my awesome programming skills.
But my systems analyst skills were the pits. I went moved from that project to another, and a “cut through the BS” kind of guy took over. He read my prolific documentation, looked through the code, and spent a week writing code for a simple file structure with only necessary features.

In retrospect, he caught me playing in the sandbox. I had added features which were above and beyond the call of duty. I had missed one of the most critical features ­­­­– time to market.

Further techno-boondoggles
Lest the reader start to get the impression that this author is somehow connected to all techno-boondoggles, I will add examples from the literature. The first I quote from Gerald M. Weinberg [3]:

A case in point is the semi-professional programmer who was commissioned by a physics professor to write a program to find the inverses of some matrices. As there were to many matrices to keep in storage at once, he needed a routine for reading them from tape [4] one at a time for processing. He had little experience with input-output programming, so he decided that this would be a good chance to learn something, and he set out to get some advice.

Was this one Rachmaninov? 

“How can I program the input from tape so as to buffer the input from processing?” he asked a somewhat more professional colleague. Being somewhat more professional, the colleague didn't answer the question, but out one of his own.
Why do you want to buffer the input?”
“To save time, of course.”
“Have you estimated how much time you will save?”
“Not exactly, but it will be a lot, because there are a lot of matrices.”
How many?
“I don’t know exactly. A lot.”
Approximately how many?”
“Maybe a hundred.”
“Good. And how large are they?”
“Ten by ten.”
The colleague did a quick calculation on the blackboard which showed that these matrices would require about a minute to read.
“See,” said the semi-pro, in triumph. “That’s a lot of time.”
“Perhaps–or perhaps not. How many times will you run this program?”
“What do you mean?”
“I mean, if you write a buffering routine, you’re going to have to test it, and I doubt if you can do that with less than one minute of machine time [5]. So if you only have one set of matrices, I’d advise you to forget it. Just the computer time in testing will cost more than you could possibly save–not to speak of your time.”
“But you don’t understand", said the semi-pro, who was not willing to see his chance of writing a new and interesting program slip away. “This has got to be an efficient program!”
His colleague should have been discouraged by this response, but could not stop himself from trying to rephrase the arguments. But, alas, it was all in vain, and the next time he chanced to see his friend–which was the next semester–he was still having problems getting his buffering routines working. The poor physics professor, still waiting for his matrices, was completely unaware of what was going on–but was mildly flattered that his programming problem was so complex.

Freeman Dyson [6] has some strong comments to make about big science. Referring to the development of the Zelenchukskaya observatory in the Soviet Union, he writes:

The committee of academicians decided to build the biggest telescope in the world....[A] Soviet astronomer told me that this one instrument had set back the progress of optical astronomy in the Soviet Union by twenty years. It had absorbed for twenty years the major part of funds assigned to telescope building, and it was in many ways already obsolete before it began to operate.

One of the factors which the committee planning the observatory did not worry about was the Zelenchukskaya weather. I was on the mountain for three nights and did not see the sky....at Zelenchukskaya the weather is consistently bad for the greater part of the year.

For those who are not yet convinced of the ubiquity of the sandbox, I recommend the book Drunken Goldfish & Other Irrelevant Scientific Research, (William Harston, published by Ballantine Books, 1987. In this book, you will learn about the effect of earplugs on a chick’s recognizing its mother, references to double puns in Vietnamese, how to make a rat fall in love with a tennis ball, and about other research which you probably cannot live another day without. Absolutely hilarious reading, from cover to cover!


Conclusions
Sandboxes are everywhere, and they are alluring. I believe that this has led to a general disdain (particularly in industry) for research groups in general. We must be aware of the lure of the sandbox, and be prepared to substitute small science solutions for our big science approaches.

Some other suggestions to keep the sand out of our undies:
Stay customer focused.
Don’t be afraid to scrap an idea if it is taking a long time.
Avoid getting too many levels deep.

-----------------------------------------------------

[1] This is actually just a little bit less exciting than it sounds. I never actually got to put my hand on the steering wheel. I wrote software to identify the latitude and longitude of satellite images.

[2] Unlike most of the lies I tell in this blog, this lie is absolutely true. Among other things, I wrote auto-focus and AGC for the first digital electron microscope back in the mid 1980's.

[3] From The Psychology of Computer Programming, by Gerald M. Weinberg

[4] This example shows that the sandbox has been around for quite a while!

[5] Back in the olden days, when programmers were real programmers, CPU time was far more expensive than programmer’s salaries.

[6] See From Eros to Gaia, by Freeman Dyson, Pantheon Books, 1992.

Wednesday, January 23, 2013

What color is red?

What is red?
Can we establish the boundaries of "red"?  If a color designer (or my wife - often the same thing) tells me that a certain shade of puce or burnt sienna is in the red family, can I really believe her? And (especially if it is my wife) do I dare to disagree with her?


I want to make sure I have articulated the question I want to ask. There is the question of what we would call pure red, and there is the question of which colors are in the red family. Rufus, pink and burgundy are all in the red family (maybe a color designer would agree with me?), but only fire-engine-candy-apple-lipstick red is really pure red.

The question of whether we all identify pure red as the same color is fascinating. Someday when I go from being a blogger pretending to be a color scientist to a fancy-schmansy researcher with 100 grad students at my beck and call, I will pursue the pure red problem. For now, I will attack the problem of defining the boundary of the red family of colors.

Color family assignments
This being a project where money is no option, I went to no expense to come up with a source of data. Wikipedia cheerfully provided me with a list of 836 color names. As if that weren't cool enough, the bottom of the article lists eleven color families: white, pink, red, orange, brown, yellow, gray, green, cyan, blue, and violet [1].
Screen shot from Wikipedia showing deep color

There were some interesting things I noted. Certain colors were in more than one family. For example, "electric indigo" was in both the blue and the purple families. I suspect that this is not just a careless mistake on an obscure color, since teal is listed in both the green and blue families, and brown is not only in the brown family (where it belongs) but also in the orange family. Now get this: not only is the color fuschia the single most frequently misspelled color name in the greater Tampa metropolitan area, but it is tri-familial. It happily resides in the pink, red, and purple families.

I'm certain if I was doing this work under government funding, I could find more examples, but for now, I will content myself with the statement that the borders of color family groups are fuzzy. There is much overlap - colors belonging to more than one family.

It is unfortunate, but the color families in this Wikipedia entry do not include all of the 836 color names, but only about a third of them. To make up for this, my wife and I went through the list, displaying them on our respective computer monitors, and each deciding which color family or families they belonged in.

In going through this exercise, I found a few areas of color space where the color family was difficult to pin down. For example, I didn't quite know where to put the colors tan, coral, and the dark reddish brownish purple of a kalamata olive or a plum. My conclusion is that there are at least three color families that are missing. I am working with Stephen Colbert to start a super PAC to get tan, coral, and plum officially recognized as color families. Contributions will be gratefully accepted.
The woebegone kalamatas

Determining the color of each color
If I were a real color scientist, and not just playing one on the internet, I would probably have paid an immense amount of money in order to poll an immense number of color designers about the color family affiliations of an immense number of physical color swatches. Then, I would have my immensely underpaid grad students use my immensely expensive spectrophotometer to measure the color of each of those color swatches. In this way, I would be able to attach real color measurements (CIELAB values) to each of the families.
The cadre of grad student slaves that I dream about having

Unfortunately - I don't know if I mentioned this before - I am not in the habit of filing for government grants, so as I said, I did the Wikipedia shortcut. Unfortunately, that left me without CIELAB values for the 836 color names that I now had found families for.

The Wikipedia entry does, however, list RGB values for each of the 836 colors that it names. It is a "simple" matter to convert from RGB to CIELAB [2]. I called on my guy Adam to whip up a little code for me to convert. Wasn't much work for me at all. Everyone should have a guy Adam.

Ellipsoidification - the heavy math part
As a result of the immense effort described in the previous two sections, I had a list of CIELAB values for each of the eleven color families. The brown family, for example, had 144 colors. Now what?

I chose to use an extremely ingenious technique which has become commonly known as ellipsoidification [3]. 

Let's just pretend for the moment that color were one-dimensional. If we had a list of color values that belong to each family, we could compute the average value for each family, as well as the standard deviation. Later, if we wanted to check if a given color fit in a given family, we would determine how close the color was to the average of that family, measured in terms of standard deviation units. If the color was within one standard deviation unit, then it would be pretty clearly that it would show up, uninvited, to Sunday dinner with that color family. If the color were to be more than three standard deviation units away, then it would be pretty clear that a formal invitation would be necessary.
Meet Henry, the Ellipsoid [4]

These statistics are perfectly fine for dealing with data that lives along a line. In our case, however, we are dealing with data that lives in three-dimensional color space. What is the analogy in three dimensions of this fuzzy interval? The technique I have used determines the ellipsoid (with arbitrary axes and arbitrary tilt) that is analogous to the interval on the line... a three dimensional version of average and standard deviation [5].

Where does the Red family live?
Now we come to the culmination of this fascinating research. I performed ellipsoidification to ascertain one ellipsoid that characterized each of the color families. Each ellipsoid was defined by a centroid, the size of each of the three axes, and two angles to define how it is tilted.

Here is the easy part. The centroid of the Red family ellipse is an L*a*b* value of {57, 57, 14}. To get an idea of how the family is arranged in color space around that centroid, I will give a series of slices through L*a*b* space, each at a different L* value.

Red does not show up at L* = 45, but it can be seen in the slice at L* = 50. You can see it living comfortably alongside the Black family. The smallest and darkest ellipse represents the one standard deviation unit region. The next two ellipses are the two and thee standard deviation unit regions.

Black and red families shown at the L* = 50 plane

As we move up in lightness to L* of 55, the neighborhood becomes a bit more interesting. The black and red families are still around, but we have started seeing the tip of the blue and purple families. The overlap between red and purple is interesting. All the colors in the purple family (at least in this range of L*) are fringe  members of the red family.

Note that the ellipses for red are getting bigger. As we move up in L*, we move to the fatter part of the red family.
Black, red, blue and purple at L* = 55

Next, we see L* of 60. Brown has joined the neighborhood, as with the purple family, the Browns are living on the red fringe.

Various color families at L* = 60

Finally, at L* = 65, the red family is starting to peter out. Anything brighter, and it won't be called "red" anymore. We see that the green family is showing up, and has some fringe overlap with blue. 
Color families at L* = 65

Summary
Let me make this clear, just in case I haven't already. There are some limitations to the data that went into these plots. My assigning of color families to the color names is a bit iffy, and my assigning of CIELAB values to the color names is also iffy.

On the other hand, I think there is some promise to the technique. Given the right data, this technique could be used, for example, to look at a CIELAB value and determine which color families it belongs in and how strongly.

Of course, there is an assumption here that color families can be approximated by ellipses. If I had more reliable data, I could test that hypothesis. Ahhh... all the fun research that I could be doing!

---------------

[1] It is interesting to note that eleven was one of my answers to the question of how many colors there are. At first, one would think that their list of eleven color families would be that same as my list of eleven color names that everyone knows. But this was not to be. Mr. Wiki did not check my blog post before writing his article. He must have heard of it though, because he had the correct number. But, the Wikipedia list omits black, and includes cyan.

[2] I say this, of course, laughing under my breath. The color I see on my computer monitor, my laptop to which it's connected, the Kindle Fire I use to stay connected while I am in the "library", and my smart phone all have a different interpretation of any given RGB value. So, I readily acknowledge that this is a soft spot in this otherwise flawless research paper/blogpost.

[3] This technique was pioneered by the venerable John the Math Guy. Maybe saying that ellipsoidification is  "commonly known" is a tiny bit premature, since the idea was first introduced in this blog post.

[4] Henry the Ellipsoid is kind of an egg-head.

[5] The math is not easy. Sorry!

Wednesday, January 16, 2013

The case for astrology

Just to make this clear from the start, I am a Scorpio, and Scorpios don't believe in astrology. I am also a math guy, by the way, and math guys don't believe in Scorpios. Is there any truth in astrological signs? I do a little experiment here on mathematicians to test this.

Recently, I was invited to join a LinkedIn group where this question showed up: "Do you believe in astrology?" There were hundreds of responses. When I last check, the number was 487. I admit that I have not read all of them, but I did read a bunch of the responses. May of them were of the form "astrology is science, but..." Here are some of the "buts".

     1. There is a dearth of competent astrologers. Most of them are quacks out to scam you.

     2. Astrology has not been systemized.

     3. The data was revised many years ago, causing it to be flawed today.

     4. There is so much to learn, that few become competent. One estimate was one in a thousand.

     5. It is science, but one requires intuition to practice it.

Wow. I'm pretty sure these folks were not in my junior high science class. If they were, I don't think they passed. It would appear that their definition of science is that it has lots of math, involves planets and stuff, and makes predictions. By that definition, the movie 2001 A Space Odyssey was science. The fact that the prediction of what was to happen in 2001 did not come true is obviously irrelevant.
What sign was Hal born under?

What is Science?

Let me clarify. I am not asking about weird science, just regular science. Everybody knows that Weird Science is a movie with Kelly LeBrock. While there may be some science involved with why LeBrock is so gorgeous, I am asking about the more general topic of Science that encompasses stuff beyond my hormones.
That which science cannot improve upon

I think that perhaps the people who commented in the LinkedIn thread have a little different take than I on what an idea has to do in order to be welcomed into the club of science. Maybe I am wrong, but here is my take on the initiation rites. 

First, a postulant postulate must be a clearly stated idea that can lead to predictions about what is likely to happen in the future. If the idea has not been systemized, too complicated to ever learn, or requires intuitin to work, then sorry, it's not science.

The second step to initiation is to put the idea to the test. A set of circumstances must be laid out, the idea must be used to create a prediction, and that prediction must come to pass, at the very least, that prediction must come to pass with better than chance likelihood.  

A couple of things really help if the idea is to join the inner circle that includes the Pythagorean Theorem, the electron, and my latest approach to making a killing on the stock market. If the idea is replicated by various people, that helps a bunch. If researchers disprove an idea, it's OK to discount a few researchers as being incompetent ninnies, but if 999 out of 1,000 are deemed incompetent, then you should probably read my blog post about cranks.
The in crowd of scientificalish ideas

Another good way to get into the inner circle is to have members in the inner circle vouch for you. If the proposed scientifical idea is consistent with all the other ideas in the inner circle, then it's got a shot. Let's say that you have a marvelous idea that you want to get into the club, and it involves the invocation of of some force from zillions of light years away that has a profound effect on your future, but only takes effect at the moment you were born. I'm thinking that might not fly. 

Testing the idea

I came up with a test of astrology, or at least of one aspect of astrology, the idea that your birth sign has some influence over your personality. If there is indeed any validity to this horoscope idea, then you would expect that people of one glamorous and specialized profession would have a tendency to fall into one of the signs of the zodiac.
Inserting math-os-sterone into certain zodiac signs

So... what glamorous and specialized professions can we come up with? I dunno... let's try mathematicians? We all know that all mathematicians are logical, stoic, without humor, and incredibly good looking. My mere existence is proof of this.
Mathematicians are fuzzy and lovable creatures

I consulted a few websites to determine which sign of the zodiac is more likely to give birth to mathematicians. Virgo seems to fit the best. 

"Virgo is the sixth sign of the zodiac, to be exact, and that's the way Virgos like it: exacting. Those born under this sign are forever the butt of jokes for being so picky and critical (and they can be), but their 'attention to detail' is for a reason: to help others. Virgos, more than any other sign, were born to serve, and it gives them great joy. They are also tailor-made for the job, since they are industrious, methodical and efficient. The sense of duty borne by these folks is considerable, and it ensures that they will always work for the greater good."
http://www.astrology.com/virgo-sun-sign-zodiac-signs/2-d-d-66951


"the Virgoan preciseness, refinement, fastidious love of cleanliness, hygiene and good order, conventionality and aristocratic attitude of reserve. They are usually observant, shrewd, critically inclined, judicious, patient, practical supporters of the status quo, and tend toward conservatism in all departments of life. On the surface they are emotionally cold, and sometimes this goes deeper, for their habit of suppressing their natural kindness may in the end cause it to atrophy, with the result that they shrink from committing themselves to friendship, make few relationships, and those they do make they are careful to keep superficial."
http://www.astrology-online.com/virgo.htm

These agree substantially with the attributes of a Virgo espoused in "The Round Art of Astrology" by A. T. Mann. I quote from page 11: "work, perfectionism, health and hygiene, diet, secondary education, analysis, prudence". The words that I typed in bold are the ones that seem to me to be consistent with the idea of mathematician.


Since the first three places I looked seem to all point toward Virgo as the preferred sign for mathematicians, I will go with that as the initial hypothesis: Mathematicians are disproportionately represented under the sign Virgo.

Now we need some data with which to test our hypothesis. I used the MacTutor History of Mathematics Archive to find my data. I figure that if a mathematician from the early 1800's made it into their list of biographies, they must be legitimately considered a mathematician. I chose the period of time from 1800 to 1840, and recorded the birthdates of all 189 mathematicians where the birthdate was known.

First, the most important question. How many were born on my birthday? Unfortunately only one.

Here is the distribution of mathematicians among the various astrological signs. I have identified the mathematicians according to both the tropical and sidereal signs [1], just in case one of them is correct and the other not.

Tropical Sidereal
Capricorn 16 17
Aquarius 16 14
Pisces 14 17
Aries 19 20
Taurus 17 14
Gemini 17 16
Cancer 14 14
Leo 14 13
Virgo 16 16
Libra 15 14
Scorpio 13 18
Sagittarius 18 16

We see that Virgo is entirely unremarkable among the signs, regardless of whether we are looking at  tropical or sidereal zodiac. Further, it is tough to see that there are any signs that favor mathematicians.

One would have though that this was a slam dunk. Mathematicians, of any professions, have earned a strong stereotype. There is nothing in this data that suggests that the astrological sign could be of any use in predicting this.
Spoiler alert - this book was not written by believers in astrology

My research is original, but not unique. In the book The Gemini Syndrome, Culver and Ianna report a list of 60 professions (including mathematician) that are not correlated with astrological sign. They also list 35 physical characteristics, and 26 personality traits that are not correlated with astrological sign.

Caveats
It's really more complicated than this

I realize that there are likely to be some naysayers. In particular, "real" astrologers generally look down their noses on a simplistic horoscope that relies strictly on the 12 signs of the zodiac. A "real" astrologer needs the exact time and location of birth to make an accurate assessment. To cast a "real" horoscope, a "real" astrologer must look at not only the position of the planets at the birth of the subject, but also the position of the planets.

Culver and Ianna reported on studies that went further, to look for correlation of some characteristic with combinations astrological sign with another aspect. They found nothing. So, clearly, you need to know the position of Mercury (12 possibilities), Venus (12), Mars (12), Jupiter (12), Neptune (12), and the Moon (12). That would give us 35,831,808 different astrological signs, each with its own destiny. It's a good thing that we have the internet, because delivering a newspaper with space for everyone's horoscope would be just too hard. 

I had a blog post about a related topic, by the way: Finding the Right Model. It says that if you are given enough variables to work with, you can model anything to as much accuracy as you wish.

But I got a question for you, Mr. or Ms. Astrologer Person. If there are almost 36 million different combinations, and looking at one or two of the variables by themselves is not fruitful, how did anyone ever figger out what personality traits and physical characteristics and fates went with which type?

------------------------------------------
[1] Tropical and sidereal?  Why are there two? It is a little known fact that the zodiac has shifted about 26 days since the time that Ptolemy codified the rules of astrological signs. Your Capricorn was not your great-great-great-great grandfather’s Capricorn. The tropical zodiac is the one in common use today..


Wednesday, January 9, 2013

Where are my CIELAB knobs?


Warning: The following blog post is rated PG for "Print Geek". Some material may not be suitable for people who aren't rabidly interested in printing, print metrics, and color science.

Where are my CIELAB knobs? (Part 1)

Back in the good old days, it was all about density. From the standpoint of the printer, density makes a lot of sense as a process control parameter. Density is a single number, and it relates directly to the only thing that can be easily controlled on press, the amount of pigment put down.

But those were simpler days. Nowadays, those darn standards, such as the ISO 12647 series and FIRST 4.0, and that whole ICC profile thing – all they talk about is CIELAB this and L*a*b* that. From the standpoint of the print buyer, this is a perfectly reasonable request. Running to a target density does not assure the proper color. A density measurement can’t tell you whether there is an unwanted tint in the ink, say, a yellow ink spiked with a bit of cyan. And even if your ink is "pure", difference in paper color and gloss do not always translate well from density to color. 

Going back to the printer again, running a job to a CIELAB target is something of a problem. There are no knobs for L*, a*, and b* on a press. At least until now... A little startup company called TheMathGuy has introduced a fundamentally new way of printing. The JMG 1000 has separate print units for L*, a*, and b* [1].

The new JMG 1000 CIELAB press, with L*, a*, and b* print units

If you were a naughty press guy, and Santa did not slide down your chimney with a brand new JMG 1000, you are stuck in the transition period from antiquated technology to the wave of the future. You need a way to determine the optimal density, that density that will get him closest to the target CIELAB value. This is part 1 of an article that describes the theoretical background of how to bridge this gap. Part 2 will talk about software that has been developed to deal with these issues.

First graph
At the very least, having a gosh-darn CIELAB target makes the whole thing very complicated. The correspondence between pigment load and CIELAB values is not so straight-forward. For a black ink, more pigment means L* goes down, but a* and b* stay the same. Ok, that's easy. But for yellow ink, more pigment only decreases L* a small amount, but the b* value increases. For cyan ink, L* and b* both go down, but the a* value drops at small densities but then levels off, as shown as in Figure 1 (red line). (Are you taking notes? I am the math guy, and I have to stop and think about this as I write it!) 
 Figure 1 – How the CIELAB values change with density (cyan version)

A slightly better graph
The rules for how CIELAB values change and the graph in Figure 1 are just not human-friendly ways to look at how to hit the target color. Can we do better?

Figures 2a and 2b are a little more intuitive look at the same data portrayed in Figure 1. These are plots of the ink trajectory for cyan [2]. Looking down at color space from above, the plots show the change in color of a cyan solid as the pigment gets richer. Note that color is three dimensional, and the “up and down” (L*) is not shown. L* goes down as the ink gets richer in color.
 Figure 2a – a*b* plot of cyan ink from a density of 0.8D to 1.8D

One notable feature of this graph is the hook at the end. When the ink reaches this hook, adding pigment will no longer increase the chroma (perceived saturation) of the ink. But adding pigment will change the hue. As you add pigment, the hue of the cyan ink turns toward blue. Anyone who has looked at a bucket of cyan ink has seen this change in hue. Anyone who has read my post Why does my cyan have the blues can explain in great detail why this happens.
Figure 2b – Close-up of 2a, with the target and several density points indicated

Figure 2b illustrates how the ink trajectory can curve around any particular CIELAB target value. In this graph, the target is somewhat arbitrarily shown as a* of -48 and b* of -44. In this case, it is not possible to exactly hit the target color. Adjusting the pigment level is like missing an exit ramp on an interstate highway. You just watch your destination go by as you drive past.

But it’s not the end of the road. The goal on press is not to actually reach the target color – just to come close enough. From the looks of Figure 2b, it would appear that the closest match occurs at a density of just below 1.50D. It would appear that the press operator just has to hold to a density around 1.48D to assure that the target color is met as close as possible. 

That closest match – the point on the ink trajectory that is closest to the target color – is called the perifarbe. The prefix of this word is shared with the words perigee and perihelion, meaning the closest approach of a satellite to the Earth or the Sun, respectively. “Farbe” is the German word for color. [3]

But before everyone goes out and jots 1.48D in their notebooks, I need to add two more things. The first is that the perifarbe density depends on all the variables in the process. Any change in the ink formulation or substrate will potentially result in the perifarbe moving. The perifarbe density should be determined whenever something changes, and ideally is calibrated on every run.

There is a little difficulty, though. Figure 2b is only part of the story. It neglects how L* is changing with respect to density. Figure 2c shows a different perspective, looking at color space from the side, rather than down from the top. In this plot it looks like the perifarbe density is somewhere around 1.39D. 
Figure 2c – Close-up of 2a, viewed in the b*/L* plane

The perifarbe graph
This failure in Figures 2a, 2b, and 2c leads us to a third diagram that allows one to determine the perifarbe, shown in Figure 3. The black line in this plot shows the color error (ΔE distance from the target CIELAB target) at each density. From this, it can be seen that the perifarbe density is a bit lower than either of the views in Figure 2 would have led us to believe. The true perifarbe is at 1.38D.
 Figure 3 – Plot of distance to target CIELAB value

Figure 3 also gives us an idea of how hard it will be to keep this job in tolerance. If the customer requires that the color be within 4 ΔE (as shown by the dashed green line), then a fairly wide range of density will bring the color into tolerance. Anywhere from 1.23D to 1.55D would be acceptable. If, on the other hand, the tolerance is 2 ΔE (as shown by the red dashed line), the acceptable density range is from 1.34D to 1.41D, and even at its best, the color will be borderline acceptable.

Summary (part 1)
In this first part, I have discussed the difficulties posed by having target CIELAB values. Through a series of different types of graphs, I have described from a theoretical standpoint what is possible. Along the way, I have introduced the phrase ink trajectory, which is the collection of CIELAB values that you can get with a given ink through adjustment of the pigmentation level. The idea of a perifarbe has been introduced, which is the point along the ink trajectory that comes closest to a target CIELAB value.

In the next part, I will take a look at various pieces of software that are available to simplify the color tweaking process on press.

Where are my CIELAB knobs? (Part 2)
In the first part of this blog post, I looked at the problem faced by printers when trying to control a press to CIELAB tolerances. I explained, through a series of graphs, how the problem could be solved. The approach, however, was theoretical. This second part of the article takes a look at practical solutions in the form of software that can be used at press side to help tune the press to the optimum CIELAB value.

How can I use this on press?
All these fancy graphs from the first part are helpful to get an understanding of what is going on, but the most important two pieces of information needed are the perifarbe density (what density gets me closest to the target CIELAB), and the perifarbe ΔE (how close can I get). Between these two numbers, the press crew can decide whether to a) leave well enough alone, b) adjust the pigment levels at press side either up or down, and by how much, or c) send the ink back to the kitchen for re-formulation.

Several options are available to make use of this analysis. While it may be possible to hire a competent applied mathematician to run a slide rule at press side, there are other possibilities that are perhaps more cost effective [4].

Some spectrophotometers come equipped with a feature that can predict these two important numbers. The TECHKON SpectroDens is one example. In the screen shot shown in Figure 4, a black patch is found to be over 6 ΔE from the target. It recommends increasing the black density by 0.24D, and predicts that the color error will drop to 0.8 ΔE.
Figure 4 – The TECHKon SpectroDens

A similar feature, called “BestMatch”, is available for X-Rite’s SpectroEye. The display is shown in Figure 5. In this example, a sea-foam green patch is measured to have a density of 1.76D. The color difference from the target is almost 7 ΔE, so it recommends reducing the density by 0.31. If this were to be done, it predicts a color error of 0.14 ΔE. One more number is worth noting is the “% -26”. This is a suggested change in concentration.
Figure 5 – X-Rite “BestMatch” feature on the SpectroEye

SpotOn! Flexo software allows this analysis to happen with several brands of spectrophotometers. In addition to being able to generate a variety of reports, Figure 6 shows a screen shot where SpotOn! is recommending running this orange ink to a yellow density of 1.37D. It predicts that the color error at this point would be 1.41 ΔE. This software can take advantage of having a computer screen (rather than the tiny screen on a handheld spectro) to provide additional information. The plot at the right of Figure 6 shows the current and predicted color against the acceptable tolerance ellipses.  
Figure 6 – Screen shot from SpotOn! Flexo

Summary (part 2)
The evolution from density control to CIELAB targets is painful, but necessary. This post has described how to make the transition from a theoretical standpoint, and then provided practical examples of software that can ease the blow. 

--------------------
[1] Caveat: These presses are not yet available. I am still trying to find a reliable supplier of b* ink.

[2] Ink trajectory is a phrase that I invented. It means the path through color space that the color of an ink takes as you change pigmentation level, ink film thickness, or tone value. Expect to hear this phrase at every TAGA conference. Incidentally, the 65th annual TAGA conference is coming up!

[3] Perifarbe is another word that I have coined. It has become a standard part of the language. I was just in the nail polish aisle at Walgreen's and heard two young ladies talking about finding the perifarbe nail polish color. Honest. If you wish to honor me, then name your yellow lab "Perifarbe".

[4] Applied mathematicians don't come cheap.