I'd like to talk about one of the most ubiquitous light sources, the fluorescent bulb. I mean, not only are they ubiquitous, they're all over the place. And at least until the recent new wave of LED illumination, they were the number two light source that tried harder. (They try harder than the #1 light source, incandescent, which was featured in my last blog post.) And for those of you who are excited by viewing booths (and quote frankly, who isn't?) I'm sure you have been just chomping at the bit, waiting for a blog post about fluorescent lights, since almost all light booths use fluorescent bulbs.
As I said, I'd like to talk about fluorescent bulbs. But I have to talk about a different sort of light emitting thingie first. You see, florescent bulbs are kinda complicated. There is a combination of two physics thingies going on: gas excitation and fluorescence. Today's blog will be about gas excitation. If that phrase caused you to snicker, then ... well, so be it.

Neon bulbs
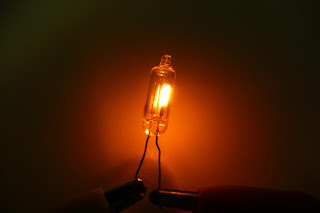
The simplest gas excitation bulb is the neon bulb. You start with a couple of electrodes close together, but not touching. You form a glass bulb around them, and squirt in a tiny amount of neon just before you seal it. Maybe you add a tiny tiny amount of argon as well. Now, you put a high voltage across the electrodes (at least 50V, but likely 110V). Lo and behold, a faint orange glow appears.
Neon bulbs have gained popularity as indicator lights. A recent Rasmussen poll put their popularity somewhere just above that of Mel Gibson. Why are they so popular? First off, they're cheap. You can buy a handful of these little puppies for about a dime apiece on Amazon. Second, they are very simple to hook into a device that plugs into household current (110V AC). All you need is a current limiting resistor, which is included in your investment of one thin dime on Amazon. Third, they draw a tiny amount of power. You would need about 1500 of them to draw the power of a 60W bulb. Fourth, they put out a pleasing warm glow that is very effective at telling someone that the power strip is live, that the soldering iron is on, or that the circuit is live.

A collection of indicator lights chosen to subliminally convey my machismo
Getting your knee on
I have no idea what is mean by the title of this section, but it has some sort of cool vibe. As does neon. I mean, it is one of the noble gases! This prestigious group of elements includes helium, neon, argon, krypton, xenon, and radon. Helium, of course, is the party gas, since it makes us talk funny. Krypton is so cool that it has a fictitious planet named after it, and it is so powerful that it makes Superman cower. And radon? What safety conscious household doesn't have a radon detector in its basement? Truly this is a noble group to belong to.
The group is characterized as those elements which have a full outer shell of electrons. (As you know, you don't want to be that guy who is one electron short of a full outer shell!) This means that they are inert, very reluctant to react. As a result, they don't get invited to many pep rallies or often get selected as game show contestants. But they do get selected for applications where engineers are trying to avoid chemical reactions. Such as light bulbs that are hot and that we want to last a long time. Argon's senior picture has the caption: most likely to be selected to make an appearance inside an incandescent bulb.
The shell game
I'm gonna start with a quote from Wikibooks, under the heading "General Chemistry, Shells and Orbitals": "Each shell is subdivided into subshells, which are made up of orbitals, each of which has electrons with different angular momentum." As I was going to Saint Ives... I sure wish I could talk purdy like that. Honestly, I have no idea what this means, but nonetheless, I will give my explanation.
Imagine a guitar string. It has a certain resonant frequency. Like, the G string will vibrate easily at around 200 Hz.(I am tempted to throw in a joke about how I frequently resonate with G strings, but that would be totally inappropriate. So I won't say anything.) This is a natural vibration mode for the string, where the whole string is moving back and forth the same way.
The G string will also vibrate at one octave above 200 Hz, around 400 Hz. If you were to watch a high speed video of the string at 400 Hz, you would see that the center of the string is not moving, and that the right and left side of the string are moving opposite from each other. Similarly, the G string has an affinity for vibrating at 600 Hz, where there are two points on the string that are immobile. This third mode of vibration is shown below. The astute reader will recognize this concept from a blog post of mine from almost exactly three years ago on the vibration of piano wires.

G string vibrating at 600 Hz
Atoms are like guitar strings. (I just googled that sentence, in quotes. Google is not aware of that sentence ever having been typed before. High fives all around! Just wait until next week!!) Just like a G string doesn't take kindly to vibrating at 260 Hz, the electrons that orbit an atom only exist in certain energy states. (Oh yeah. I forgot to mention that each frequency has a different energy level associated with it. It takes more energy to get something to vibrate quickly, so the higher the frequency, the higher the energy level. Each energy state corresponds to a specific frequency/wavelength.)
So, you got this atom. Let's get just for example that an electron in this particular type of atom can be at energy states of 13 banana units, 15 banana units, and 20 banana units. An electromagnetic field induces the electrons way up to the 20 banana unit state. Eventually, the electrons will grow tired of hanging around up there, and they will drop down to another state.
If they drop down to the 15 banana unit state, they will lose 5 banana units of energy. Since energy is conserved, a little packet with 5 banana units of energy needs to be spit out. It gets spit out as a photon with 5 banana units of energy. Since energy and wavelength are related, this photon proudly moves to its proper place in the rainbow - the location that corresponds to 5 banana units of energy.
If an electron drops all the way down from the 20 to the 13 banana unit state, it will lose 7 banana units of energy. Now we have photons that are at the 5 and 7 banana unit locations of the rainbow.
There is one other possibility - an electron that dropped to the 15 banana unit state could drop a second time and wind up at the 13 banana unit state. Hence we also see some photons in the 2 banana unit state. A third position on the rainbow.
Going through the possibilities, we can expect there to be photons at three discrete positions (that is to say, wavelengths), corresponding to 2, 5, and 7 banana units of energy, as illustrated below.

Monkeys falling from tree branch to tree branch
The size of the yellow circle represents how loud of an uf-da the monkey makes
The size of the yellow circle represents how loud of an uf-da the monkey makes
Emission lines
If you were looking for the section on transmission lines, I suggest you might want to check out a different blog. On the assumption that you are actually interested in how all this orbital decay stuff ties into neon bulbs, then read on.
Based on this business about discrete energy levels leading to discrete energy levels for the emitted photons, we kinda expect that the spectral output of a neon bulb to be equally discrete. Here is my expectation, based on some website somewhere that looks like it's reliable. They use big words, anyway.

I got put my ultra-sophisticated spectrometer, for which I paid about two years' salary, and put one of my neon light sources in front of it. The spectra below shows what I saw. Strong peaks, but not really the very narrow lines that we might expect. I am going to blame that on my spectrometer. Although it reports every nanometer, the spectral resolution is around twelve nanometers.

My spectrometer looks at neon
Tech note: There is a spectral blur in any spectrometer that has to do with a design trade-off. Most spectrometers require collimated light, which is accomplished by focusing light on a slit aperture. The narrower the slit, the finer the spectral resolution, but also the smaller the amount of available light. Less light means either longer integration time or more noise.
Actually, a neon bulb can be used to measure the spectral resolution of a spectrometer. I looked through the data to find the wavelengths on either side of the peak where you reach 50% of the max: 579 nm and 592 nm. The difference between these is the FWHM resolution. FWHM stands for "Full Width at Half Max".
Do my peaks line up with the advertised values?
| Mine | Theirs |
| 585 | 585.2 |
| 612 | 609.6 |
| 637 | 640.2 |
| 669 | |
| 702 | 703.2 |
| 724 |
Actually, I am rather impressed. The two peaks in the official-looking plot which are most isolated (585.2 nm and 703.2 nm) are almost right on the money.
But why are the others off? The key is that we need isolated peaks to test for correct placement of emission peaks. Because the resolution of my spectrometer blurs the spectrum, several peaks got averaged together, and so the center got shifted.
Another tech note: This is the technique used to calibrate spectrometers. Typically, the factory calibration lab will have a set of gas discharge lamps such as neon, but also maybe krypton, xenon, argon, and/or mercury.
How about doing color matching under neon bulbs?
Neon bulbs are very efficient and inexpensive. Individually, they don't emit a whole lot of light, but they're small and cheap. Presumably, I could wire up a gazillion or so of these to make a really groovy light booth for evaluating color. And since we know the spectrum so accurately, it should make for really accurate evaluation of critical color, right?
The short answer is no. And the long answer is "good golly gosh, no!" Take another gander at the spectral emission plot of the neon bulb. Note in particular what we see happening below 570 nm. Nothin'. Virtually no light at all.
Consider a yellow ink. Above 550 nm, it looks almost indistinguishable from the paper it's printed on. So, I would argue that a neon bulb color booth is about as useful as Braille on the keypad of a drive-through ATM.

Yellow ink
They have a measure that is an index of how good a light source is at properly rendering color. Ironically, it's called the Color Rendering Index, or CRI for short. The color rendering index of a neon bulb is zero. That's on a scale from 0 to 100. So, kinda not so good.
A few similar bulbs
You know those orangey-yellow lights that are used for street lights? High-pressure sodium vapor lights, also known as HPS by the cool people. Not to be confused with high-pressure sodium vapor light salesmen, who tell you how great the bulbs are cuz they are very efficient.
But have you ever tried to find your car at night in a parking garage with these kind of lights? I bet that high-pressure sodium vapor light salesman never told you that the HPS lights have a CRI of 20. Color is greatly distorted.

You'll never guess what gas is used in these puppies!
How about those really bright bluish-white lights that are used as security lights, as overhead lights in high-bay factories and stores, and as floodlights in a stadium? Those are likely to be metal halide bulbs. As with all the other gas excitation bulbs, these have a gas and a high voltage which causes electrons to jump around to different energy levels, giving off light at specific discrete wavelengths. Theses bulbs come in at a whopping 54 CRI.

Rock concert? Make sure you get the heavy metal halide floodlights!
By the way, just to make sure I am not misunder-terpretted, getting a score of 54 on a 100 point test is not so good. Of the bulbs in this blog. the metal halide bulb does the best job of making colors look right, but note that even metal halide is kinda short of energy on the red end. That's where it lost a lot of points on the CRI test. But, I should point out that the spikes don't help a lot either.
Next time, I'll talk about fluorescent bulbs. I promise.
Fine job as always. In some future blog please explain why the plot labeled "Emission lines of neon" has such narrow spiky peaks but the plot below it ("My spectrometer looks at neon") has such broad peaks.
ReplyDeleteI tried to give a quick answer to that, but evidently missed the mark.
DeleteIf I look through a microscope, I have an inherent resolution. I can resolve certain tiny features, but can't resolve anything smaller. Maybe I can resolve the legs and eye facets of a fly, but can't see the hairs on the legs. Maybe I can resolve the scales on the hairs of the legs of the fly. To get better resolution, you need a combination of different optics and more light.
So it is with a spectrometer. In the case of my spectro, I can resolve spikes that are about 12 nm apart. This amount of spectral blur is good enough for color measurement, but might not be so good if you were interested in picking out all the emission lines to identify what gases are in the tube.
Does this answer the question, or are you looking for a deeper understanding of what limits the resolution in a spectrometer?
Please do a post someday on CRI. Specifically: I've got a spectrum of a light source. How do I calculate the CRI? Also: I've read that CRI is not acrually the best indicator of color rendering, particularly with spiky sources like fluorescents and LEDs. Yuji, for example, throws a lot data out there beyond that included in CRI (http://www.yujiintl.com/high-cri-led-lighting). What other indexes/standards are there for measuring the color rendering performance of a light source, and how do we calculate those from a spectrum?
ReplyDeleteThanks for your interest, Anonymous. That is the direction that I am heading with this series of blogs. I have a few more posts on background information before I get to that topic!
Delete